Google Analytics 4 (GA4) continues to roll out valuable updates that make data analysis smoother and more insightful. The September 2024 update brings several enhancements to reports, helping you gain a deeper understanding of user behavior and traffic patterns. Let’s take a gander at the most important updates and how they can improve your reporting experience.
1. Anomaly Detection: Instantly Spot Unusual Trends
One of the most exciting updates is the addition of Anomaly Detection in detail reports. This feature automatically flags any unexpected spikes or dips in your data, represented as circles on your charts. Hovering over these anomalies gives you additional context, helping you pinpoint significant events or issues without needing to manually sift through the data. This is especially useful for tracking traffic surges or identifying potential issues like sudden drops in conversion rates.
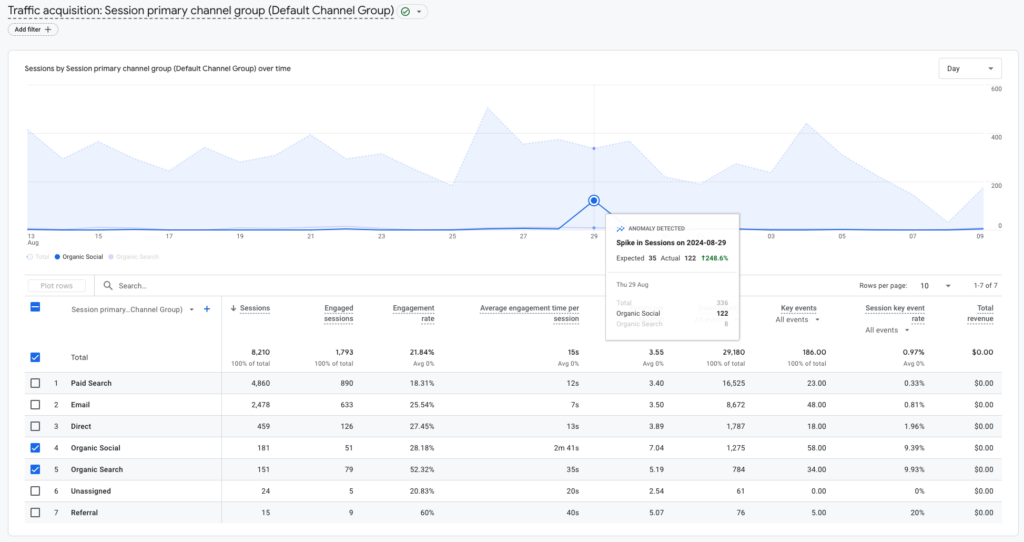
Example: If a product page experiences a sudden spike in visits overnight, anomaly detection highlights it immediately so you can investigate whether it’s due to a successful campaign or a technical glitch.
2. Enhanced Metrics in Acquisition Reports: Clearer User and Session Data
GA4’s Acquisition Reports now come with improved clarity, separating user- and session-related metrics. In the User Acquisition report, you’ll find metrics such as Total Users, New Users, and Returning Users, providing a detailed look at how new users interact with your site. Meanwhile, the Traffic Acquisition report offers session-related metrics like Sessions, Engaged Sessions, and Sessions per Event. This makes it easier to distinguish between overall traffic trends and individual user behaviors, enabling more effective decision-making.
Example: If you’re looking to optimize your user journey, these reports help identify whether new or returning users are more engaged.

3. New Transactions Report: Dive Into Revenue Data
For e-commerce businesses, the new Transactions Report under the Monetization section provides a granular view of your revenue. This report allows you to drill down into individual transaction IDs and view details such as the number of purchases, purchase quantities, and revenue generated by each transaction. It’s ideal for tracking high-value transactions and understanding purchasing behaviors.
Example: You can now easily see which specific transactions are contributing the most to your total revenue.
4. Plot Rows: Compare Data Directly in Reports
GA4’s new Plot Rows feature makes comparing specific data points in your reports easier than ever. To use it, head to the Traffic Acquisition report under Acquisition. This feature lets you select any five rows from the table and include them in the time series chart at the top of the report. Previously, the chart only showed the first five rows by default. Now you have full control over which rows are visualized. Simply deselect the default rows, choose the ones you want to visualize, and click “Plot Rows.” The time series chart will instantly update to reflect your selection, allowing for quick, intuitive comparisons.
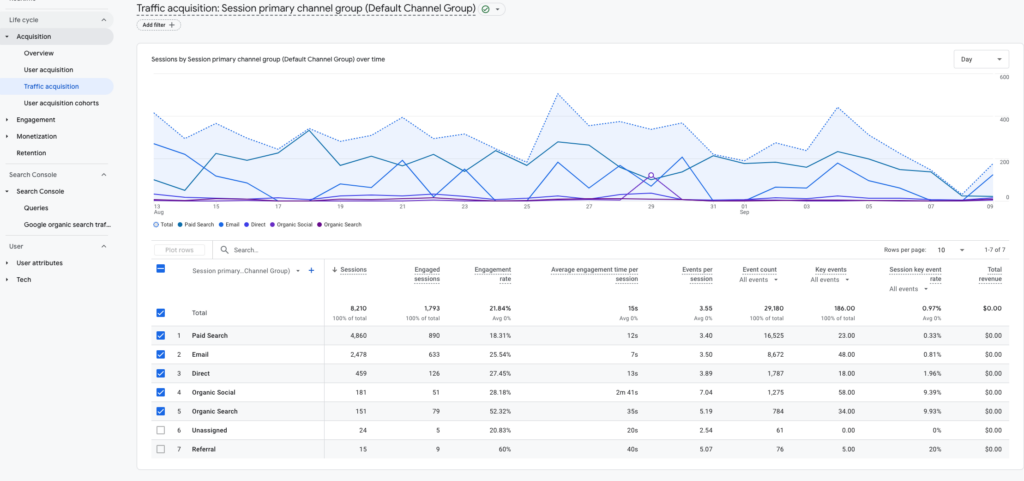
Example: You can plot traffic from different channels in the Acquisition report. This allows you to quickly compare how each marketing campaign is performing over time.
5. Mark Key Events in the Events Report: Highlight Your Most Important Actions
You can now mark your most important events directly in the Events report. Do this by selecting the three-dot menu next to an event (at the very right of the table). Then proceed by marking it as a Key Event. This makes tracking and reporting on conversions easier than ever. Focusing on key events helps you prioritize what’s most critical to your business, whether it’s form submissions, purchases, or another user action.
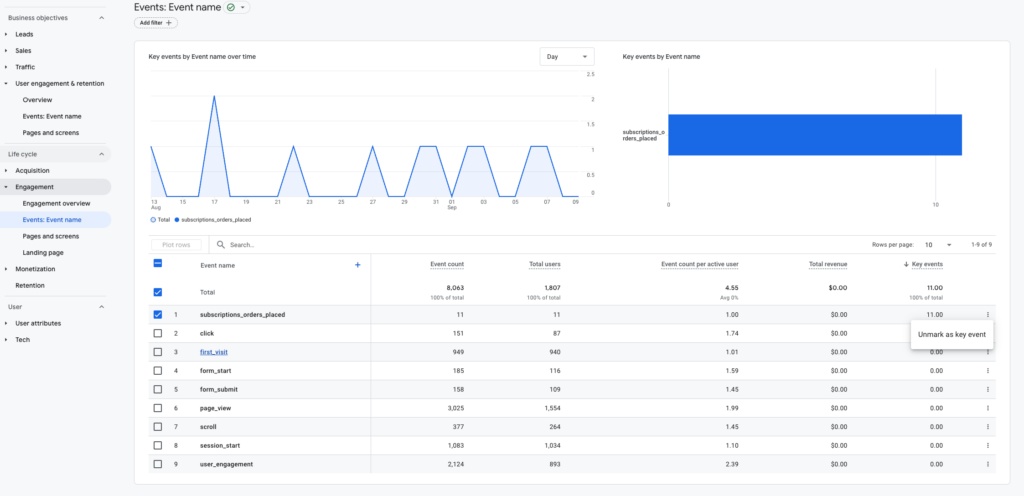
Example: If form submissions are a key goal, marking them as a Key Event ensures you can quickly measure and report on their performance.
6. Report Descriptions: Get Quick Insights on Reports
GA4 has introduced a helpful new feature that provides Report Descriptions. Simply hover over the title of any report, and a brief description will appear, explaining the report’s function along with a link for more information. This is particularly useful for those new to GA4 or when navigating less familiar reports.
What’s Next?
These six new enhancements are currently rolling out, so if you don’t see them in your Google Analytics account yet, they should be available soon. These updates are designed to streamline your data analysis process, making it easier to spot trends, compare key metrics, and act on insights faster.
Need Expert Help with Google Analytics 4?
Whether you’re just getting started with GA4 or looking to optimize your reporting and analysis, Project 3 Consulting can provide expert guidance. Our team specializes in advanced analytics, data strategy, and helping businesses make the most of tools like GA4. If you need support implementing these latest features or want to take your analytics to the next level, don’t hesitate to reach out.
Contact us today to learn how we can help you achieve more with your data.


