
Tip 1: Data Retention Setting
What is this data retention setting all about? By default, Google Analytics will discard your raw data after two months. That means not all your data will be available in your reports inside Google Analytics. Though it only affects certain reports inside Google Analytics 4, you may as well take full advantage of GA4 and set it to 14 months. If you’re looking to take your data analysis to the next level, you can set up Google BigQuery to store and analyze all your raw data outside of Google Analytics. This will allow you to download your raw data into Google’s data warehousing solution and analyze it yourself. It’s a bit more advanced, but totally worth it if you’re serious about your data.
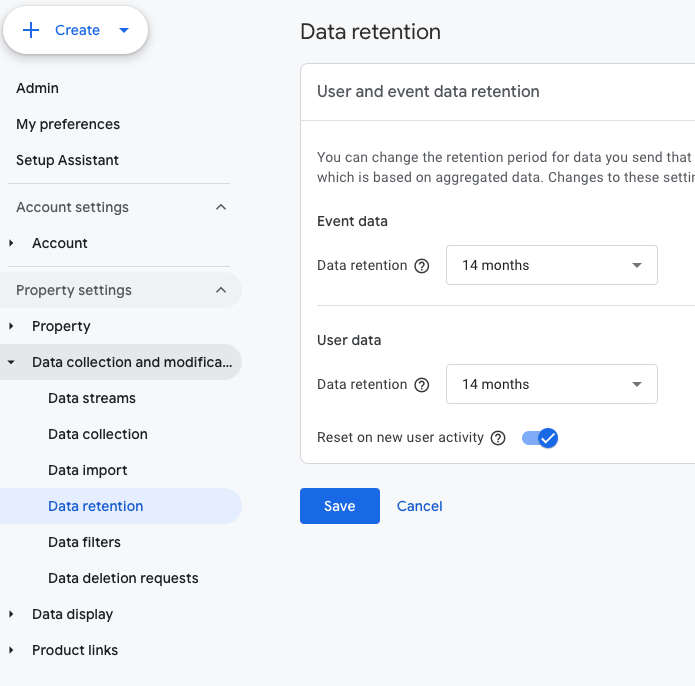
To edit your Data Retention period, go to Admin > Data Collection and Modifications > Data Retention.
Tip 2: Do not forget to activate your DebugView
DebugView in GA4 is an essential feature for testing and troubleshooting your implementation. It allows you to see real-time data flowing into your property, helping you ensure that your tracking is set up correctly.
Do you see any data flowing in the debug view? Go to Configure on the left side menu, then go to DebugView, where you can see the timeline of events. If nothing is happening, it’s because you need to enable the DebugView, which means you have to use either the Analytics Debugger extension or the Google Tag Manager preview. You have two options here: you can either turn it on the extension or preview your Tag Manager container. Once activated, you can navigate through your site and watch as events are logged in real-time within GA4. This helps you verify that all your important interactions, such as page views and custom events, are being tracked correctly.

Tip 3: Find your Conversion Rate
Conversion rate is one of the most critical metrics for understanding the effectiveness of your marketing efforts, so you definitely should have it in your reports. Conversion rates measure how many of your site visitors turn into paying customers. For example, if 1,000 people visit your eCommerce store and 20 make a purchase, your conversion rate is 2%. Tracking this helps you see which marketing efforts are driving sales and where you might need to make adjustments. Just a heads up, GA4 has renamed “Conversions” to “Key Events,” but it essentially means the same thing.
In order to find your conversion rate, click on Engagement in the left menu, then click on Events. Go to the top right corner, then click on the pencil to customize the report. From there, you can add “Session Key Event Rate” and add “User Key Event Rate” as metrics. This customization ensures that you can quickly analyze conversion performance and make informed decisions to optimize your marketing efforts.
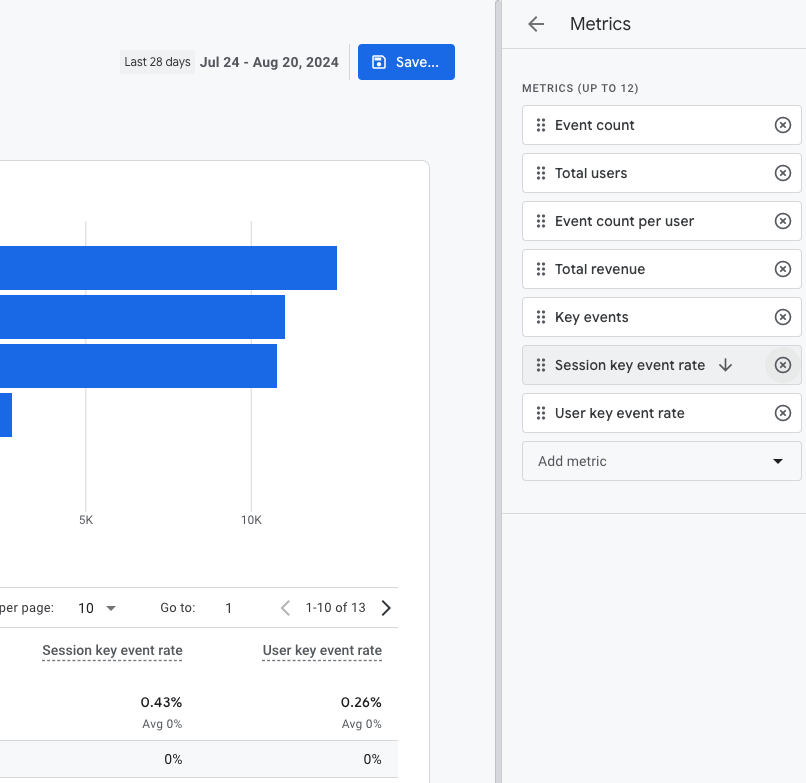
To add your conversion rate, click on Engagement in the left menu, then click on Events. Go to the top right corner, then click on the pencil to customize the report. From there, you can add “Session Key Event Rate” and add “User Key Event Rate” as metrics.
Tip 4: Register your Event Parameters as Custom Definitions
In GA4, event parameters are the specific details you track for each event. For example, if you’re tracking a purchase event, parameters might include the product name, price, and quantity. However, to make these parameters accessible in your reports, you need to register them as custom definitions.
To register your event parameters, go to settings and then “Custom Definitions.” Here, you can create new custom dimensions or metrics by providing a name, selecting the scope (usually “Event”), and pasting the event parameter exactly as it’s defined in your GTM setup. Once you click save, you’re done! You’ve registered your custom definition, and it should be available within your reports.
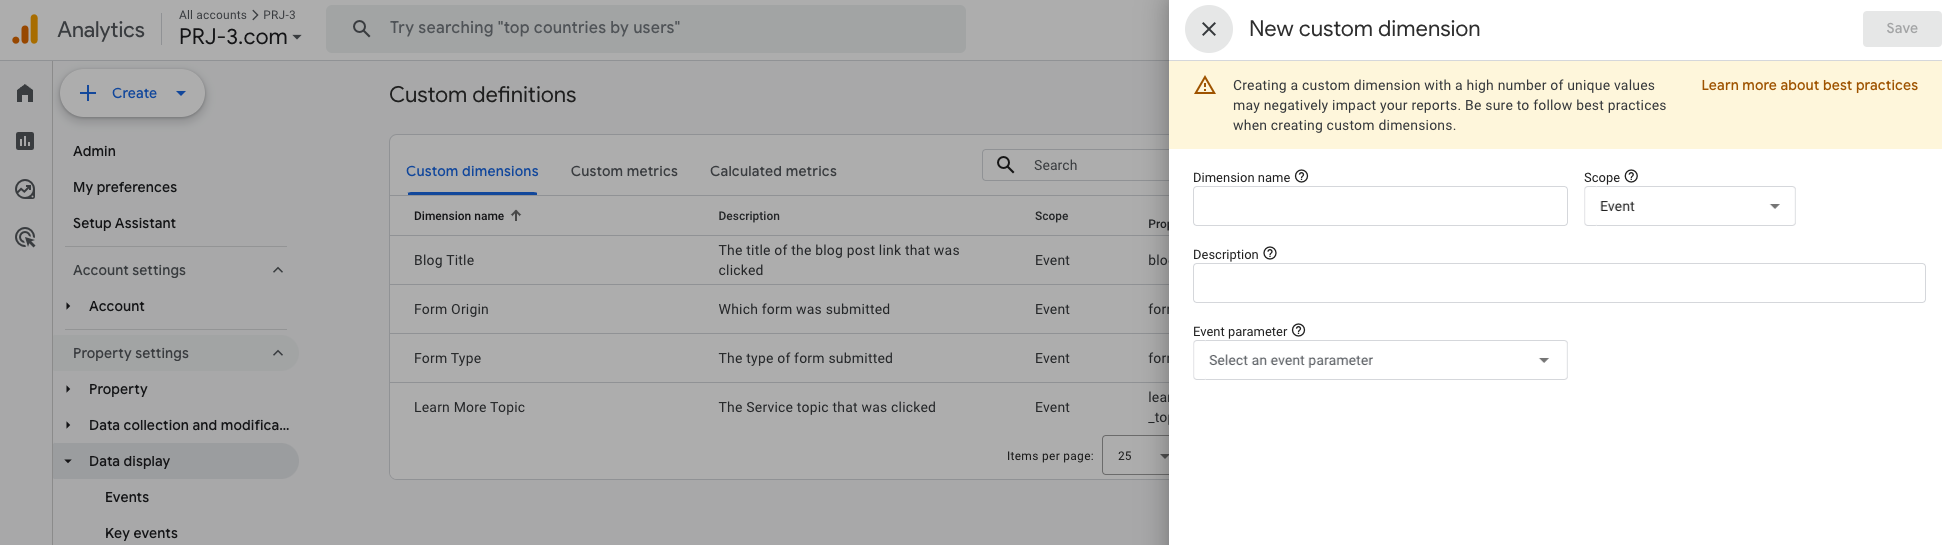
To register your event parameters, go to settings and then click on Custom Definitions.
Tip 5: Create your Sales Performance report
Understanding your sales performance is essential for making informed decisions about your product offerings, pricing strategies, and marketing efforts. GA4 has a ton of reports, but finding the one you need can sometimes feel like a scavenger hunt.
If you’re looking for your sales performance report, here’s how to get to it: Go to Reports, then Monetization Overview. Scroll down until you see a little card that says “Purchase Revenue by Other Coupon.” Click on that, and you can change the primary dimension to “Transaction ID” to get a more detailed view.
And if you want to keep this report handy, you can customize it and add it to your collection. No more digging around every time you need to check your sales performance!
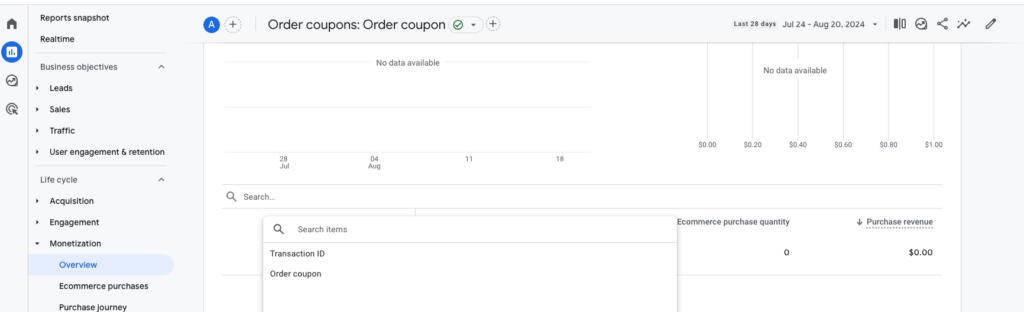
To find your sales performance report, go to Reports, then Monetization Overview. Scroll down until you see a little card that says “Purchase Revenue by Other Coupon.” Click on that, and you can change the primary dimension to “Transaction ID” to get a more detailed view.
Conclusion
Getting the hang of GA4 might seem tricky at first, but these tips will make things a whole lot smoother. Whether you’re tweaking your data retention or setting up custom reports, these steps will help you get the most out of GA4. It’s all about making the platform work for you, so feel free to experiment and find what suits your needs best.
If you’re looking for even more tricks to optimize your GA4 setup, Project 3 Consulting is here to help. Our team knows all the ins and outs to make your analytics work harder for your business. Reach out to see how we can take your data game to the next level. Happy tracking!