Project 3 Consulting
  • Services
    • Analytics Audits
    • Tag Management
    • Guardian
    • MarTech Migration
    • Talent Management
    • Data Governance
    • CDP Strategy
    • CRO Services
    • Fractional CMO
    • Fractional CTO
  • Platforms
  • Insights
    • Blog
    • Case Studies
    • Events
    • White Papers
  • About
    • Our Story
    • Careers
  • 1 (877) 355-7753
Let's Connect

Case Study: Data Visualization

by Jonathan Mark | May 15, 2025 | Case Study, Data Visualization, Looker Studio

Case Study Empowering Smarter Decisions with Looker Studio Project 3’s Transformation of Data Visualization and Reporting for Diverse Industries Using Looker Studio Share on LinkedIn - Case Study Details In this case study, we explore the challenges faced by three...
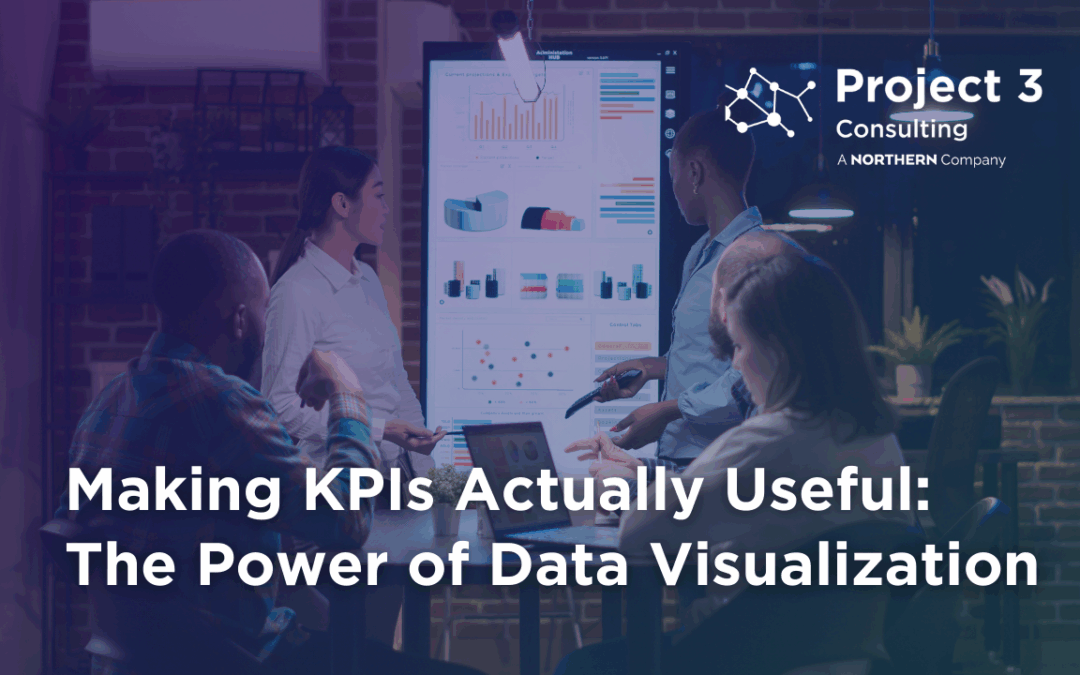
Making KPIs Actually Useful: The Power of Data Visualization

Making KPIs Actually Useful: The Power of Data Visualization

by Jonathan Mark | May 7, 2025 | Blog, Data Visualization, Looker Studio, PowerBI, Tableau

Ready to turn all those numbers, dashboards, and KPIs into something people actually understand? Good, because that’s Data Visualization is all about. Chances are, your business already tracks plenty of KPIs — from conversion rates to sales figures and beyond. But...
How Tableau Published Data Sources Drive Collaboration and Faster Insights

How Tableau Published Data Sources Drive Collaboration and Faster Insights

by Jonathan Mark | Apr 17, 2025 | Blog, Data Visualization, Tableau

We all know that working with data can be a bit of a chore. But what if you could skip the repetitive tasks and jump straight into analysis? That’s where Tableau Published Data Sources come in. Rather than each person in your organization creating their own data...
How a Tableau Center of Excellence Supports Your Organization

How a Tableau Center of Excellence Supports Your Organization

by Jonathan Mark | Feb 24, 2025 | Blog, Center of Excellence, Data, Data Visualization, Tableau

Imagine you’re a business that’s just added Tableau to your MarTech stack. You’re excited — after all, it’s another powerful tool to help your organization make smarter, data-driven decisions. But as the excitement fades, a few questions start to creep in....

Recent Posts

  • Making KPIs Actually Useful: The Power of Data Visualization
  • How Tableau Published Data Sources Drive Collaboration and Faster Insights
  • Recapping the Magic and Mayhem of Adobe Summit 2025
  • The Ultimate Analytics Guide to Adobe Summit 2025: Sessions, Swag, Parties & Vegas Tips
  • Project 3 Joins Forces with Northern Commerce

Recent Comments

No comments to show.

Need Help With Your Project?

Let's Work Together!

Reach out to Project 3 and tell us how we can help.

Thank you! We'll be in touch shortly.

Let’s Connect

About Us

  • Events
  • Sponsorships
  • Partners In Prosperity
  • Careers

Services

  • Analytics Audits
  • Tag Management Audits
  • Guardian
  • MarTech Migration Services
  • Talent Management
  • Data Governance and Compliance
  • CDP Strategy
  • CRO Services
  • Fractional CMO
  • Fractional CTO

Contact Us

  • Contact Us
  • 1 (877) 355-PRJ3
  • Privacy Policy
  • Terms of Service