Case Study
Empowering Smarter Decisions with Looker Studio
Project 3’s Transformation of Data Visualization and Reporting for Diverse Industries Using Looker Studio
-
Case Study Details
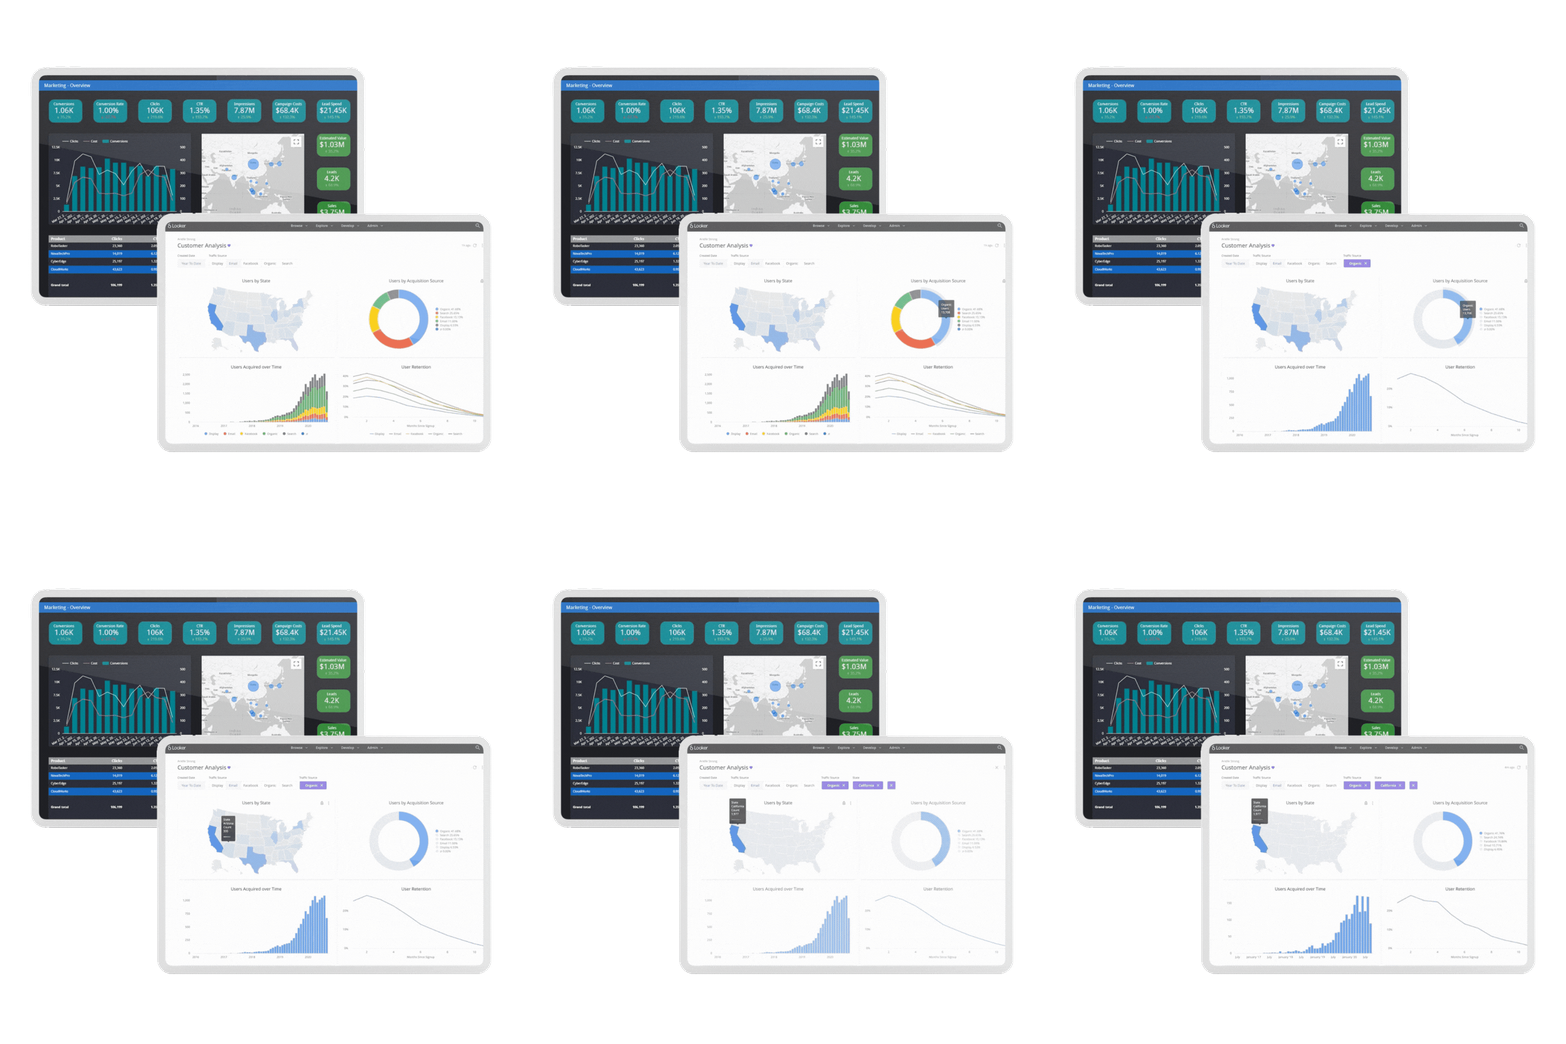
In this case study, we explore the challenges faced by three distinct organizations we worked with in the past—Healthcare Industry Association, Global Robotics Manufacturer, and Strategic Financial Advisors—whose names have been anonymized for privacy. These organizations sought to improve their data visualization and reporting capabilities using Looker Studio. Each company encountered difficulties with fragmented data, inefficient reporting processes, and a lack of centralized insights, which hindered their ability to make timely, data-driven decisions. Looker Studio provided a solution to consolidate their data sources, streamline reporting, and create customized dashboards, enabling these businesses to better analyze and act on critical metrics in real time.
Key Challenges
- Fragmented Data Across Multiple Platforms
- Slow and Inefficient Reporting Processes
- Lack of Centralized Data Insights for Real-Time Decision-Making
- Difficulty in Creating Custom Dashboards for Actionable Insights
Key Technologies
- Looker Studio
Key Services
- Data Visualization Strategy
- Data Integration and Consolidation
- Custom Dashboard Development
Objectives
The Healthcare Industry Association, Global Robotics Manufacturer, and Strategic Financial Advisors sought to enhance their data-driven decision-making capabilities through Looker Studio. Each organization faced challenges with fragmented data, slow reporting processes, and a lack of centralized insights, limiting their ability to act on critical information in real time. Their primary objectives were to streamline data integration, create real-time dashboards for actionable insights, and improve reporting efficiency across departments. Ultimately, the goal was to empower decision-makers with a single, unified view of their key metrics, allowing them to drive smarter business strategies and increase operational efficiency.
Challenges
Healthcare Industry Association:
- Multiple data sources with varying formats made it difficult to create coherent reports.
- Lack of a centralized reporting platform for quick access to marketing and customer data insights.
Global Robotics Manufacturer:
- Production and operational data were siloed across various departments, making it hard to create a consolidated view.
- Struggled with manually tracking KPIs, which led to time-consuming processes and delayed reporting.
Strategic Financial Advisors:
- Financial and customer data existed in multiple platforms, leading to a fragmented view.
- Difficulty in extracting actionable insights from the data in real time to make strategic decisions quickly.


“Project 3 Consulting really helped us clean up our reporting process. By integrating all our data into Looker Studio, we went from manually pulling reports every week to having real-time dashboards that track our KPIs. It’s been a huge time-saver, and now we can make data-driven decisions faster and with more confidence.”
— Global Robotics Manufacturer
Strategy and Implementation
Project 3 Consulting stepped in to address these issues by:
Healthcare Industry Association:
- Implemented Looker Studio to integrate data from multiple sources, such as Google Analytics, social media platforms, and CRM tools, into a single platform.
- Developed custom dashboards that allowed the organization to track marketing performance, customer engagement, and sales metrics in real time.
Global Robotics Manufacturer:
- Designed and deployed Looker Studio dashboards to consolidate production data from various departments.
- Created key operational reports, such as machine performance, downtime tracking, and supply chain efficiency, which were previously tracked manually.
- Enabled automated reporting to save time and improve decision-making.
Strategic Financial Advisors:
- Utilized Looker Studio to connect financial and customer data from multiple platforms (e.g., CRM, financial software, and analytics).
- Built a centralized data hub, making it easier for decision-makers to view financial health, client engagement, and marketing performance.
The Results
Healthcare Industry Association:
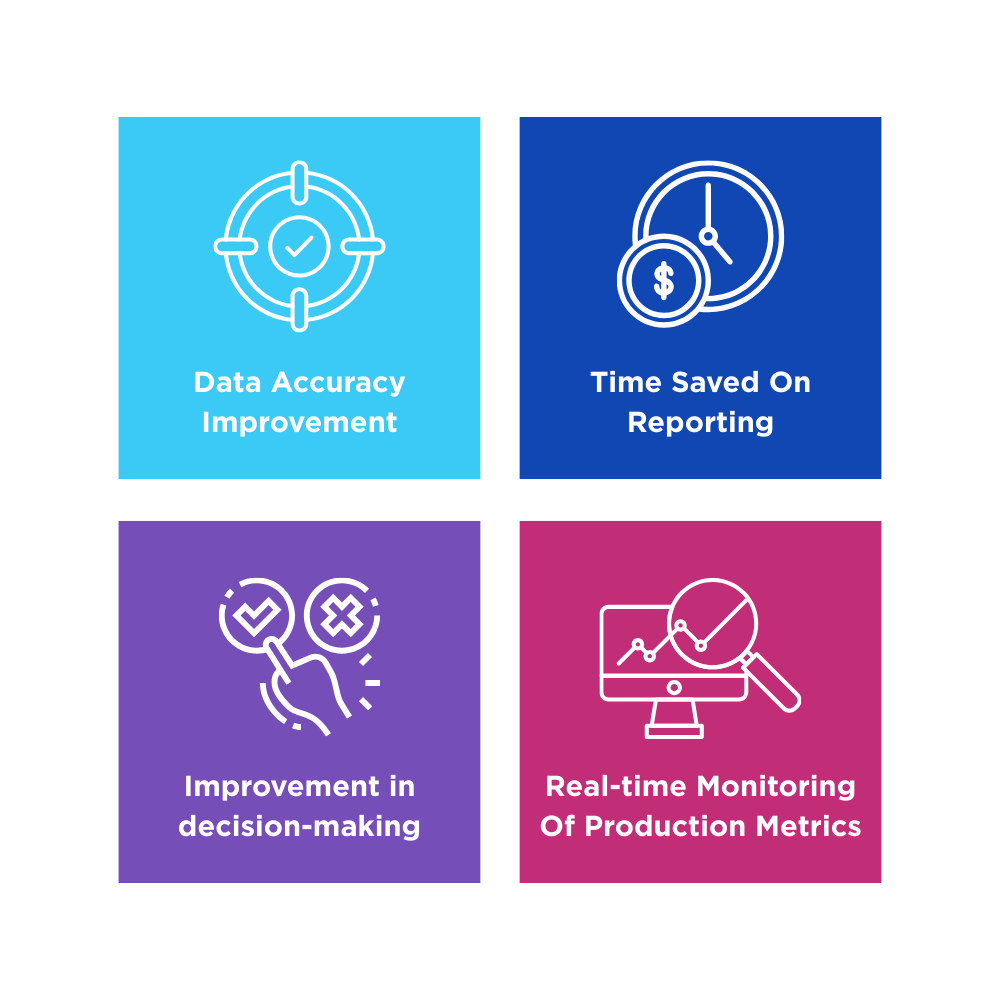
- Reduced time spent on manual reporting
- Increased access to real-time insights, leading to more informed decisions about marketing campaigns.
- Improved data visibility across departments, streamlining collaboration.
Global Robotics Manufacturer:
- Real-time monitoring of production metrics helped increase machine uptime and improve overall operational efficiency.
- Enhanced cross-department communication and better visibility into the production process.
Strategic Financial Advisors:
- Increased the speed of financial decision-making by providing real-time views of client portfolios and operational budgets.
- Improved data-driven decision-making, with enhanced visualizations that helped identify opportunities and risks faster.
- Reduced reporting errors by automating data gathering and reporting processes.
Looker Studio proved to be a powerful solution for these three organizations, enabling them to overcome their data fragmentation challenges and streamline their reporting processes. By consolidating data sources and creating customized, real-time dashboards, they were able to make more informed decisions, increase operational efficiency, and improve data-driven strategies across their businesses. With Looker Studio, each company gained a unified view of their key metrics, empowering their teams to act swiftly and confidently on critical insights.

