
Ready to turn all those numbers, dashboards, and KPIs into something people actually understand? Good, because that’s Data Visualization is all about.
Chances are, your business already tracks plenty of KPIs — from conversion rates to sales figures and beyond. But here’s the real challenge: most dashboards end up being too complicated, too cluttered, or too vague to help anyone make truly meaningful decisions.
In this blog, we’ll walk through why KPIs alone aren’t enough, how to make them truly impactful, and how to visualize them in ways that drive real action — not just passive reporting.
Grab a coffee, and let’s get into it.
What Is Data Visualization and Why It Matters
Let’s start with the basics. Data visualization is simply the art of turning numbers into pictures — charts, graphs, maps, and dashboards that help people see patterns, make comparisons, and spot trends.
The goal? Making your data easier to understand and act on.
Instead of scanning a 12-tab spreadsheet or reading a 20-page report, someone can glance at a well-made chart and say, “Oh, I got it.”
And no, you don’t need to be a data scientist. From marketers to sales leads to product managers, anyone can create visualizations that bring KPIs to life — especially with today’s range of accessible tools.
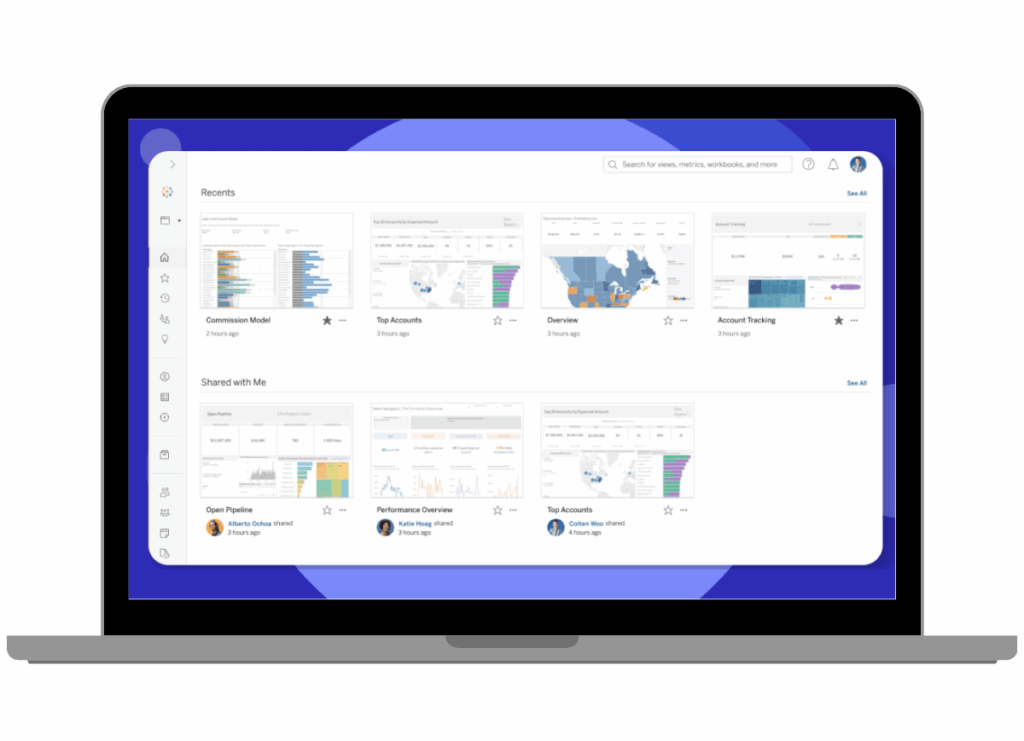
Popular platforms like Tableau, Power BI, and Looker Studio make it easier than ever to build meaningful, interactive dashboards:
- Tableau offers powerful data exploration and dashboard-building capabilities. It’s widely used for enterprise-level storytelling and complex visualizations that connect to multiple data sources.
- Power BI integrates tightly with Microsoft 365 and is great for teams already using Excel. It offers strong modeling features and quick setup for internal reporting.
- Looker Studio (formerly Data Studio) is Google’s free, browser-based tool that’s perfect for visualizing data from Google Analytics, Sheets, and BigQuery — ideal for marketers and digital teams.
Clear visuals. Faster decisions. This is what data clarity looks like.
Whether you’re looking to explore trends, align teams, or inform big decisions, the right visual — and the right tool — can make all the difference.

The Business Value of Visualizing KPIs
We all know KPIs are supposed to be helpful. But here’s the catch: if they’re buried in a sea of metrics or wrapped in confusing visuals, they’re not actually useful.
Let’s talk about why smart visualization turns KPIs into action.
1. It Makes Insights Click
You could show someone a revenue number. Or you could show them this month’s revenue, compared to last month’s—complete with a little green arrow and “+12%.” Boom. Insight.
Use case: You’re a major retail brand gearing up for end-of-quarter reporting. Instead of digging through five tabs of SKU-level spreadsheets, you open your dashboard and immediately see: denim is up 18%, outerwear is slipping, and accessories just passed last year’s numbers. With clean visuals—bar charts by category, trend lines over time, and traffic source overlays—you know exactly where to double down on promotions and where to pivot.
That’s the power of making KPIs visual.
2. It Surfaces What Matters
People don’t want more data—they want the right data. Good visualization highlights what’s important and quietly fades out what’s not.
Use case: You’re leading commercial operations for a global pharmaceutical company. A new medication just launched across five countries, and leadership needs to know: Where is adherence lagging? With a color-coded heat map on your dashboard, you can instantly spot that patient engagement in Germany and Brazil is below the expected 60% threshold. No need to sift through weekly Excel exports—just click into the visualization, filter by region, and zoom in on patient support program impact. You’re not just reporting—you’re course-correcting in real time.
3. Reduces Noise and Complexity
Dashboards with 24 widgets? Good luck figuring out which dashboard matters. Fewer, clearer KPIs—each tied to a visual that actually means something—wins every time.
Use case: You manage operations for a high-volume manufacturing plant. Every minute of downtime is money lost. Your dashboard lights up: uptime is at 91%, but one line is showing a spike in defects during the night shift. A trend chart layered with temperature and humidity sensors points to a climate control issue. With that visual insight, you flag facilities before quality control escalates it. No backlogs. No finger-pointing. Just fast decisions from clear data.
4. Drives Confident Decision-Making
A number sitting in a box doesn’t drive action. A chart showing where performance is slipping (with a benchmark line that’s been crossed) does.
Use case: You’re overseeing risk across a growing portfolio at a wealth management firm. A radar chart on your executive dashboard tells the story instantly: exposure to tech is creeping above target, while fixed income is underperforming on yield. Instead of scrambling through performance reports, you’re adjusting allocations during Monday’s strategy call—with full confidence that the visuals reflect what matters most to the business. It’s your decision engine.
Determining Whether a KPI Is Worth Tracking
Before you even touch a chart, ask this one question:
“If this number changes, will it lead to a decision?”
If the answer is “probably not,” it’s a vanity metric.
Here’s what we mean:
Imagine you’re a digital marketing lead at a large finance firm. One of your dashboards proudly shows that your latest email campaign had a 48% open rate. Great, right?
But then you ask: “So what?”
Does that number influence budget decisions? Campaign strategy? Channel prioritization?
Maybe not. It’s interesting, but it doesn’t necessarily change anything.
Now flip it: what if instead you were tracking revenue per email sent?
Suddenly, you’ve got a KPI that links directly to business value. If that number spikes, you might want to replicate the campaign. If it tanks, it’s time to adjust messaging, targeting, or send time. The KPI prompts action. That’s the difference.
Here are a few other smart swaps that make dashboards more decision-ready:

The best KPIs are outcome-focused. They reflect goals, not just activity. And most importantly—they make it clear what to do next.
Key Use Cases for Data Visualization
Data visualization isn’t just about making charts look nice, but it sure does help capture attention when it counts. More importantly, visuals help surface insights faster, guide decisions, and keep teams aligned. Here are a few places where visualization really shines:
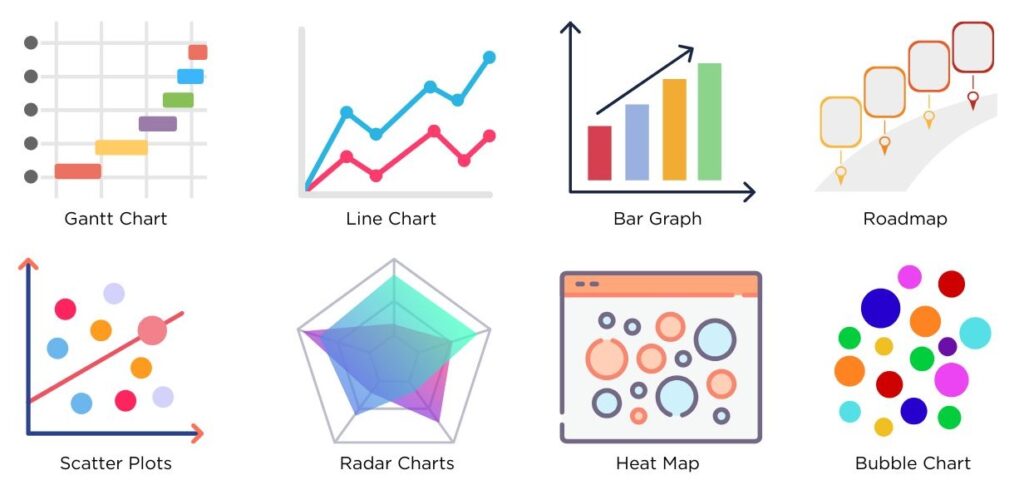
- Planning timelines (Gantt charts, calendars, roadmaps)
Visual timelines bring structure to complex projects. Whether it’s launching a new product in retail or managing a pharmaceutical trial, Gantt charts and roadmaps make it easy to see task dependencies, deadlines, and bottlenecks—so teams can stay on track and adjust in real time. - Spotting trends over time (line charts, area charts)
Trends often get buried in spreadsheets. Line charts shine when you want to show changes in sales performance, production yield, or patient adherence over time. A single chart can reveal seasonality, spikes, or slow growth—so you can react faster and smarter. - Finding relationships (scatter plots, bubble charts)
These visuals help uncover patterns you might not expect—like the correlation between marketing spend and conversions in finance, or temperature and defect rate in a manufacturing facility. They’re especially useful when dealing with multiple variables or complex datasets. - Tracking frequency or seasonality (bar graphs, heat maps)
Whether you’re analyzing daily warehouse incidents or weekly prescription refills, frequency visuals make it easy to see spikes, gaps, and seasonal behaviors. A heat map, for example, can show when retail site traffic peaks—helping you time campaigns more effectively. - Assessing risk and value (scorecards, radar charts, dashboards)
Scorecards and radar charts help translate complex metrics into clear, actionable insights. Finance teams use them to monitor exposure and compliance, while manufacturers may use them to compare operational performance across multiple facilities. These tools help teams prioritize resources and make confident, risk-aware decisions.
No matter what you’re trying to figure out—there’s probably a visualization that makes the answer obvious.
Choosing the Right Chart for the Job
Not all charts are created equal. Choosing the right visual makes the difference between instant understanding and total confusion. Here’s a breakdown of some of the most effective chart types—and when to use them:
- Pie Chart
Best for visualizing a small number of categories (ideally 6–7 or fewer) where the differences in value are clear. Great for showing proportions like market share or budget allocation.
Example: A retail dashboard might use a pie chart to show the percentage of total sales by product category for a single month. - Bar Chart
Excellent for comparing values across groups. Bar charts are easy to scan and perfect for dashboards where users need to see how different options stack up.
Example: A pharmaceutical brand can use bar charts to compare drug adoption rates by country or clinic. - Line Chart
The go-to choice for displaying data trends over time. If you want to show movement, growth, or patterns over days, months, or years—this is your best friend.
Example: Finance teams may use line charts to track ROI or stock price fluctuations over the past 12 months. - Stacked Area Chart
Useful for showing how parts of a whole evolve over time. This chart type allows you to see both individual segment growth and cumulative totals.
Example: A manufacturing company could use a stacked area chart to visualize units produced by product type across multiple quarters. - Radar Chart
Ideal for comparing multiple dimensions of performance or capability—especially when those metrics don’t follow a simple hierarchy. Radar charts work great in scorecard-style views.
Example: A retail chain might use radar charts to compare store performance across criteria like foot traffic, sales, staffing levels, and customer satisfaction. - Infographics
When you need to provide context, weave in narrative, or guide someone through a story—not just show numbers—infographics shine. They’re great for executive summaries, campaign recaps, or public-facing content.
Example: A pharmaceutical company could use an infographic to visually explain trial results to stakeholders, combining visuals, key KPIs, and concise explanations.
Choosing the wrong chart? That’s how you confuse people instead of helping them. The right chart delivers the insight, while the wrong one will just add unnecessary noise.
Best Practices for Building Effective Dashboards
No matter how good your data is, it won’t land if the dashboard isn’t built with the user in mind. Here are a few tried-and-true best practices to make your visualizations not just functional—but actually useful.
- Know your audience.
Are you presenting to executives? Keep things high-level and outcome-focused. Stick to the KPIs that reflect business impact, and avoid overwhelming them with granular details. If you’re talking to analysts or operations teams, go deeper. They’ll want to explore the data, filter by variables, and drill down into the “why” behind the numbers. The same dashboard doesn’t work for everyone, so be sure to tailor the experience. - Limit your metrics.
Just because you can track 30 things doesn’t mean you should. A cluttered dashboard creates noise, not insight. Focus on the 2–5 KPIs that drive real decisions. The goal is clarity, not coverage. It’s better to get three critical metrics 100% right than to monitor fifteen that never get acted on. - Design with care.
Your dashboard isn’t a Pinterest board—keep the styling clean and distraction-free. Use 2–3 fonts max, maintain consistent spacing, and apply color intentionally (not just to make it look pretty). Think contrast, not chaos. And make sure your visual design is accessible—especially for users with color blindness or screen fatigue. - Always include a legend (when needed).
If a user has to guess what your colors or shapes mean, your dashboard has already failed them. Legends are essential for multi-line charts, heat maps, stacked bars—anything where visual cues aren’t obvious. Keep them concise, aligned, and close to the visuals they support. - Use tools that work for you.
Don’t get stuck on what’s trendy. Instead, choose the platform that fits your team’s skills, needs, and tech stack. Whether it’s Tableau for enterprise-grade analysis, Looker Studio for fast Google integrations, Power BI for robust data modeling, or something no-code like Visme for stakeholder storytelling, just make sure the tool helps you tell the story without overcomplicating the process.
Final Thoughts: From Raw Data to Business Clarity
KPIs aren’t magic. They don’t do anything on their own. But when they’re well-chosen and well-visualized? That’s when the magic happens.
If you’re building dashboards, think like a storyteller—not a spreadsheet. Help people see what matters, connect the dots, and take action.
Looking to sharpen your own dashboards or bring clarity to your data?
Project 3 Consulting can help. Whether you’re just getting started or need to clean up a messy setup, our team specializes in data visualization strategies that actually drive results.
Contact us here and let’s make your data work for you.